Unlock the Episode: Listen and Download the Free MP3 from My Podcast Today!
SUMMARY
- Flowcharts and Storyboards Overview: Flowcharts and storyboards are essential visual tools for conveying design details to various stakeholders. Detailed flowcharts save time during instruction development and improve the likelihood of client approval.
- Flowchart Functionality: Flowcharts depict control flow in eLearning courses using shapes and connections. They represent steps, decisions, sequences, and data flow, aiding comprehension over verbal descriptions.
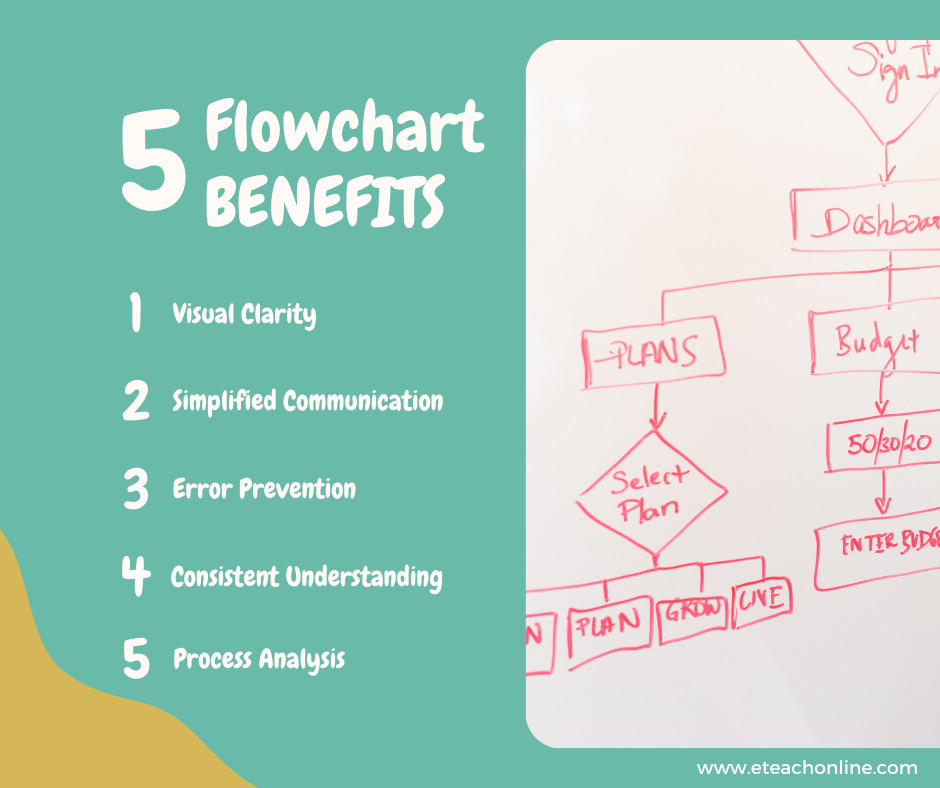
- Benefits for Instructional Designers: Flowcharts help novice and experienced designers depict tasks and processes effectively. Universal symbols condense information, facilitate discussions, and identify problem areas.
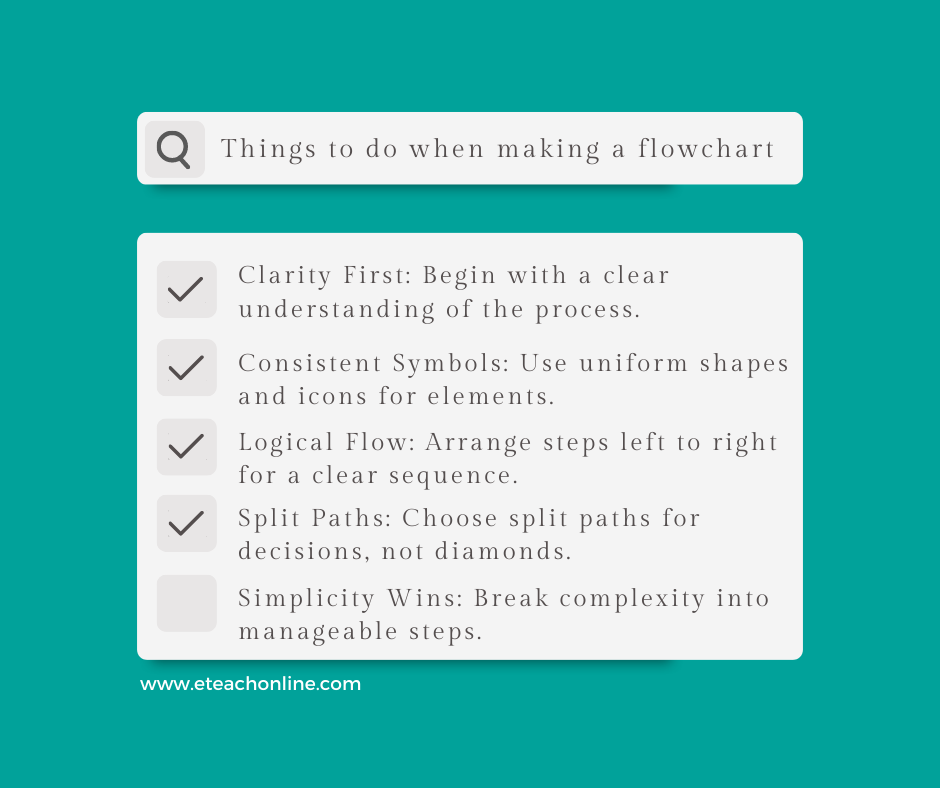
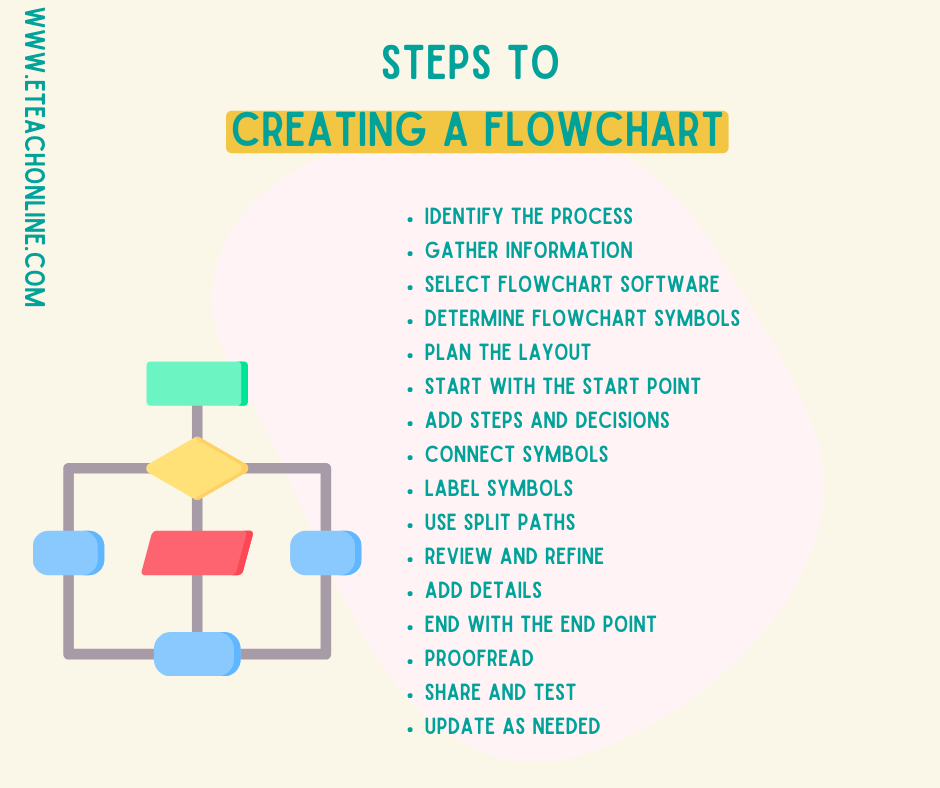
- Effective Flowchart Design Tips: Consistent design elements, such as shapes and spacing, improve clarity. Keep flowcharts on one page or use hyperlinks to connect divided sections. Organize data flow from left to right for easy comprehension. Use split paths instead of traditional decision symbols for clarity. Place return lines below the flowchart for logical reading.
- Integration with Storyboards and Project Success: Flowcharts complement storyboards by conveying design plans to developers, artists, and experts. Clear communication through flowcharts and storyboards ensures successful project development and client satisfaction.
INSPIRATIONAL QUOTES


TRANSCRIPT
Together, flowcharts and storyboards are highly useful tools for visually conveying information about your design to developers, graphic artists, and subject matter experts. The more time you spend elaborating on details of script, graphics, and functionality in your flowcharts and storyboards in the beginning, the more time you will save in the development of your instruction. Even more importantly, the better your flowcharts and storyboards convey your instructional plan to your client, the more likely you are to obtain client approval and funding. A flowchart is a graphical representation showing the flow of control among the steps in an eLearning course. In the Instructional Design Framework, flowcharts provide a bird's-eye view showing the structure and sequence of a lesson. The elements themselves are represented by simple icons, such as circles, rectangles, diamonds, or other shapes. This is done so that the view is focused on the way the user will move through the steps in a process. Lines always represent connections between events, usually with arrowheads that show the direction or order in which they occur. A flowchart indicates sequences and decision points as well as starting and stopping points. It is much easier to grasp relationships visually in a flowchart than in a verbal description. Therefore, these diagrams help us avoid leaving out steps in the process. As it can be seen in the example, distinct shapes are used to represent different types of information. Flowcharts are especially very useful for instructional designers who are for the most part novice or occasional designers. You may feel that as an instructional designer there is little if any need for you to learn about flowcharts, but that's an incorrect assumption. Whatever area of instructional design you go into, you will need to at least know how to read the flowcharts. For example, instructional designers use flowcharts to depict steps to follow when performing a task. Through the use of flowcharts, you can convey to someone else the steps and decisions someone performs when they do something. The symbols used are universal and they allow you to condense a lot of information into a little space. In addition, flowcharts can be used as a springboard for further discussion of the process. Flowcharts also connect with other flowcharts explaining related activities. They're also used to identify points where data can be usually collected and analyzed. They isolate possible problem areas, and lastly, they communicate the process to those unfamiliar with it. Producing a clear and detailed flowchart requires you to begin with a brief overview of the process or instruction and progress to the level of detail that is necessary for your instruction. Simple lessons, such as tutorials, require little detail while complex lessons like simulations require considerably more. As stated earlier, the more time you spend on flowcharting, the less time you will spend later correcting program errors. As you've learned so far, flowcharts can be an effective, efficient way to show the steps in your online course, but you should also understand that flowcharts can be confusing and even misleading if not properly prepared. When designing and creating a flowchart, bear in mind that the diagrams need to be easy to understand. Now I will discuss five tips. By applying these tips, you will be able to make flowcharts that are easier to read, understand, and use for your eLearning course. Number one, use consistent design elements. Elements, such as shapes, lines, and text within a flowchart diagram should be consistent. This example shows how consistency is applied. Notice how only the start and end shapes are oval. All the others are rectangles. Every shape is the same size, as is the spacing between them. They also have the same outlines and are aligned uniformly. Using consistency eliminates unnecessary distraction and makes the data flow or workflow very easy to follow. Sometimes color is helpful in making process steps clearer. Certain types of processes, such as decisions, might be shown in a different color, as might steps that require the user to return to an earlier step. Spacing, on the other hand, should always be consistent. Most drawing programs require you to do this manually, which can be time-consuming. So if you're looking at software, be sure to look for something with automated drawing and formatting built in it. Number two, keep everything on one page. It is good practice to make sure that the flowchart fits on a single page and the text remains readable. When a diagram becomes too large to fit on a page, it's advisable to divide it into multiple charts and connect them with hyperlinks. To keep your flowchart to one page, you should try a few solutions outlined below. If it's just slightly too big, try scaling it down. Remember, though, that the font that you're using will also scale. For example, if you’re using a 10-point font scale and scale the diagram to 60% of its original size, your font is now effectively 6.5. A tip here is to use a larger font that will offset the reduction in scale. In this example, if you reset your font to 16 points of a 60% scale, it will result in a 9.6-type size font. Of course, using a larger font will properly increase the sizes of the symbols, so you might need to make a few adjustments to get the right look. Depending on the number of steps, you can also have your chart flow left to right, then down to a subsequent line where it continues. It will look something like this. Another way to handle a large flowchart is to break it up into a collection of smaller ones. Do this by starting with a top-level diagram that provides a brief summary of the steps in the complete process. Each of these brief summaries will then contain a hyperlink to a separate flowchart that shows the details of that step. The steps in the detailed flow charts may themselves be summaries of even more detailed steps or sub-processes. These will, in turn, be hyperlinked in the same manner. This may continue into several layers of detail. Number 3. Flow data from left to right. Structuring a flowchart from left to right makes the information easy to read and comprehend. Number four, use a split path instead of a traditional decision symbol. Traditional flowcharts use a diamond symbol to represent a decision. There are three inherent problems with this. Number one is a decision symbol immediately introduces two directions of information flow, breaking the left to right rule and making the flowchart more difficult to follow. Number two, most users don't understand the meaning of various symbols, so the introduction of a diamond shape is distracting. And number three, most creators of flowcharts are also unfamiliar with the conventional symbols, thus using them randomly creates confusion. The use of a split path eliminates all three of these problems. It continues the left-to-right process flow, and it's easy to understand without explanation. Here's an example of showing the same process using a split path versus a traditional decision symbol. Number five, the last tip, is to place return lines under the flow diagram. Since we naturally read text from the top of the page down, it is logical that return lines should be placed under the flow chart rather than above. If two return lines are needed, then they shouldn't overlap. Here's an example of how return lines should look. Now I'll show you some examples of good flowchart design in practice. An inherent problem has emerged in that traditional flowcharts are frequently created in such a way that they aren't easy to understand because they don't follow my five tips for high quality flowchart design. Let's look at a few flowchart examples that can be improved by applying these design tips. This diagram is designed with a top-down orientation. It uses traditional symbols such as decision diamonds in a document shape. One of the problems that can be encountered using traditional flowchart designs is that they can be difficult to both create and use in a simple, understandable manner. For example, note that the modified project box has no outlet, thus the user faces a dead end at this point. Here's a redesign of this flowchart. It follows a more readable left-to-right flow. Rather than diamond-shaped decision boxes, it employs a split path. Notice how the modified project box now has a return arrow that directs the user back to a previous step in the workflow process. The other notable difference in this example is that there are only two shapes. Ovals for start and end of the process and rectangles for everything else. This format doesn't require any deciphering on the part of a user. Flowcharts by themselves do not tell the entire story. Storyboards that depict each box in your flowchart are used to give developers a visual representation of each computer screen. You should now understand that flowcharts, like storyboards, are used to create, to clearly display the structure and sequence of your plan instruction. Flowcharts are specific icons to represent your graphics, content, and functionality features. The more complex the instructional plan, the more detailed your flowchart should be. Above all, you should now understand that the visual information you provide in a flowchart should be sufficient to allow you to delegate instructional development work to a team of developers, communicate your graphic needs to graphic designers, and clearly convey your instructional plan to your subject matter expert and or your client. This step is especially crucial as without this clarity and detailed communication, it may be difficult to obtain funding and move forward through the development, implementation, and evaluation stages of the instructional design job.
JOIN THE
eLearning and Instructional Design for Beginners Community
- In-depth courses & training
Access my rapidly growing library, attend monthly live training & accountability support groups
- Exclusive tools & members-only discounts
Tools, templates, downloads, checklists and more - plus receive special perks & discounts
- Supportive community & network
Feedback and support from fellow instructional designers, career-driven business owners, and experts who will keep you on track
Get Your Software Toolkit for Instructional Designers
Tools & processes that will help you plan, build, and grow your instructional design career and freelance business.


